


- Home
- Sustainability
- Environmental Preservation
- Environmental Management Data
Environmental Management DataSustainability
Environmental management data (non-consolidated data for former VES)
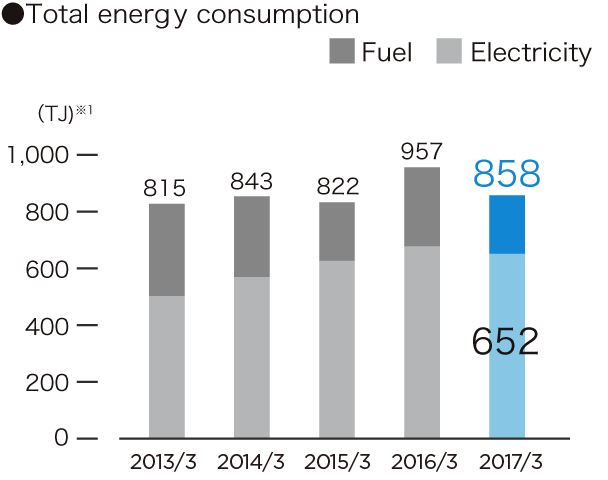
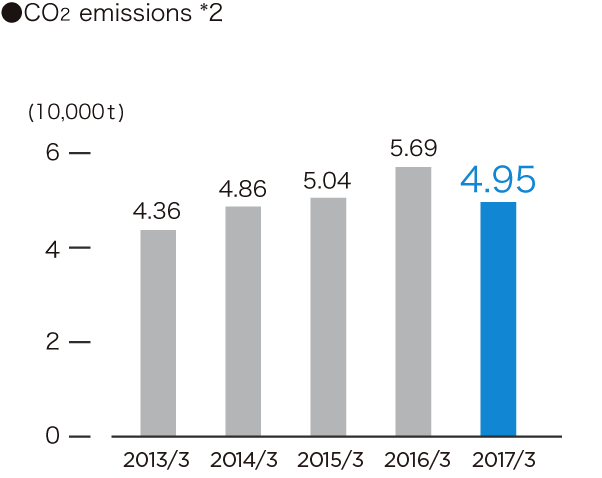
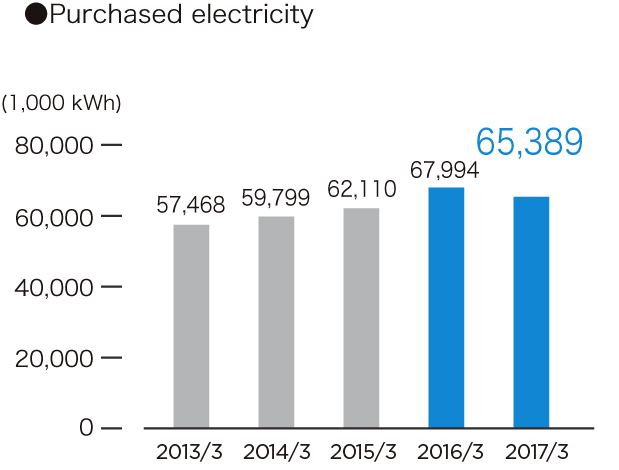
Energy consumption and CO2 emissions
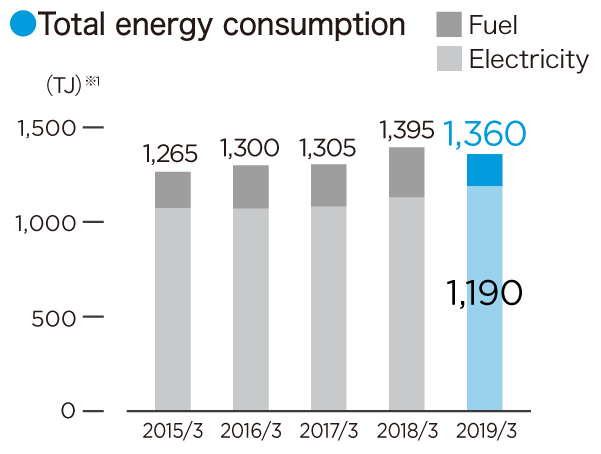
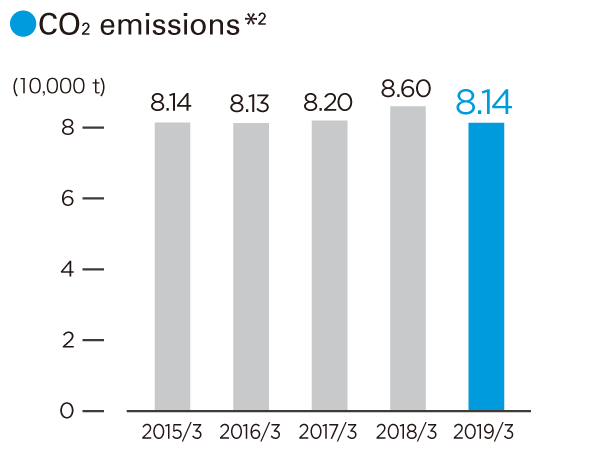
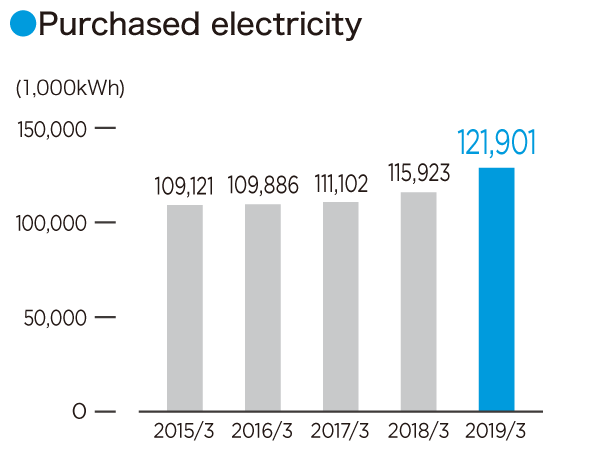
VES continues its efforts to reduce CO2 emissions through activities such as switching the fuel for in-house power generation from heavy oil to natural gas. The graphs show our total energy consumption, CO2 emissions, and purchased electricity over the past five years. Corresponding with a decrease in the manufacturing of ships and diesel engines, our mainstay products, total energy consumption for 2018/3 decreased slightly year on year. As a result, CO2 emissions dropped approximately by 5% from 2017/3 level.
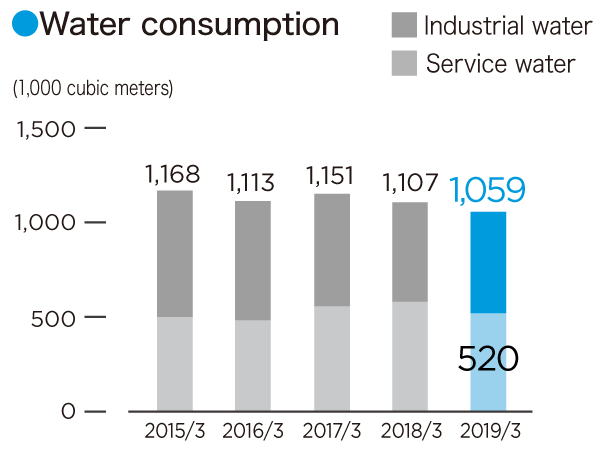
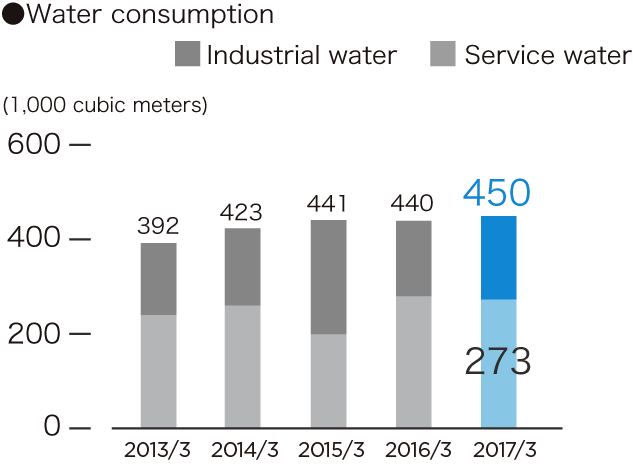
Water consumption
The graph shows the use of water by VES over the last five years. VES uses both service water (clean water) and industrial water (intermediate water). We strived to save water as a result the amount of service and industrial water used was dropped approximately by 4% from the previous year.
*1 TJ: Tera Joule (=1012J) *2 CO2 emissions were calculated by following the Guidelines for Calculating Corporate Greenhouse Gases Emissions issued by the Ministry of the Environment. CO2 emissions from electric power were calculated by using the adjusted CO2 emission coefficient for designated electric enterprises that was also published by the Ministry of the Environment.
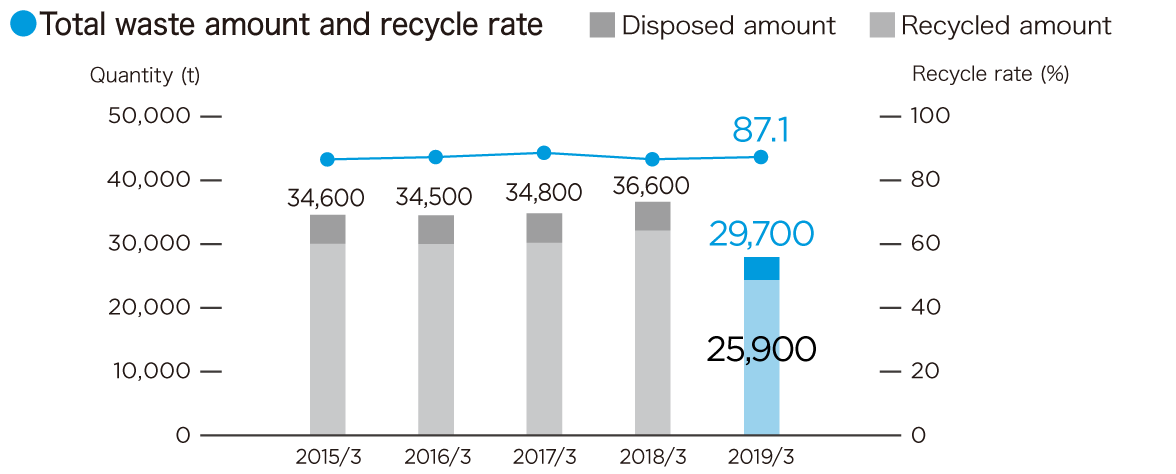
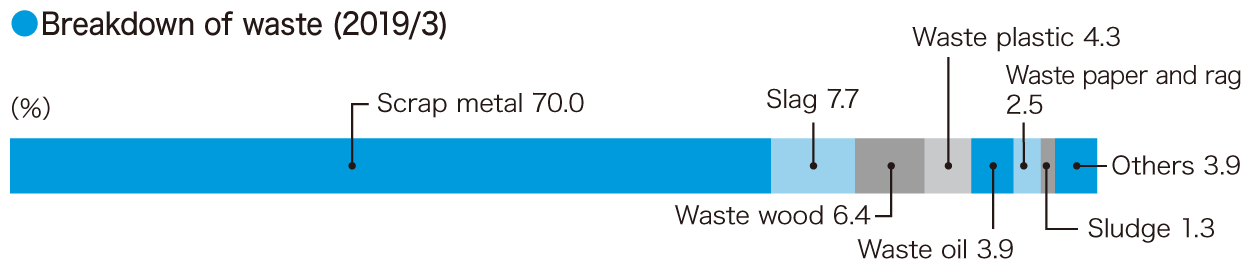
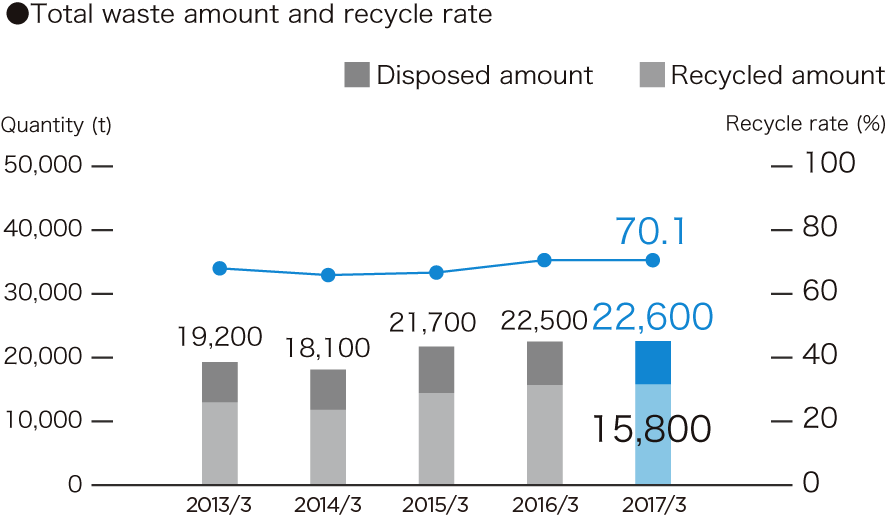
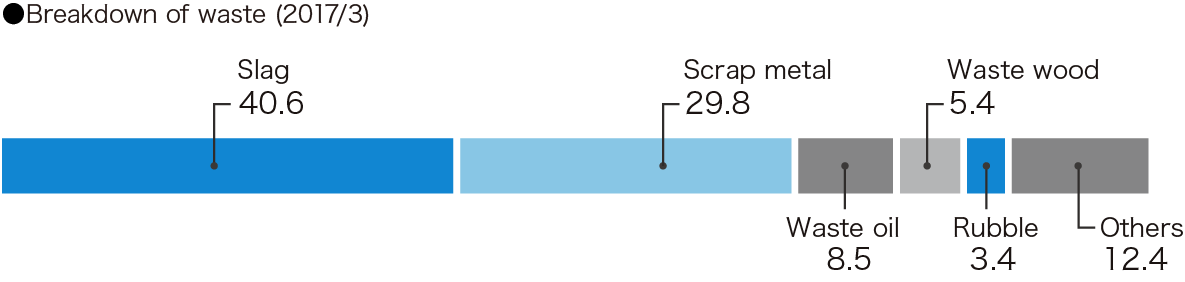
Waste disposal and recycle rate
The unlawful dumping of industrial waste has become a major social problem. As a producer of industrial waste, VES makes every effort to fulfill its responsibilities in this area. One of these efforts is our strict management of manifest. This is accomplished through periodic on-site inspections of disposal companies. Even more important is our effort to reduce the amount of waste itself. To achieve this objective, we work hard to recycle and thoroughly classify our waste. The graphs show the waste amount and recycle rates over the past five years, and a breakdown of waste for 2018/3. We worked to limit waste, as a result we saw an approximately 19% decrease in waste from the previous year. In addition, the recycle rate increased by approximately 0.5% to 87.1% because of the increased amount of slag and waste plastic that we recycled. We will continue our efforts to reduce waste and improve our recycle rate. In addition, we will continue to properly dispose of our waste through strict management.
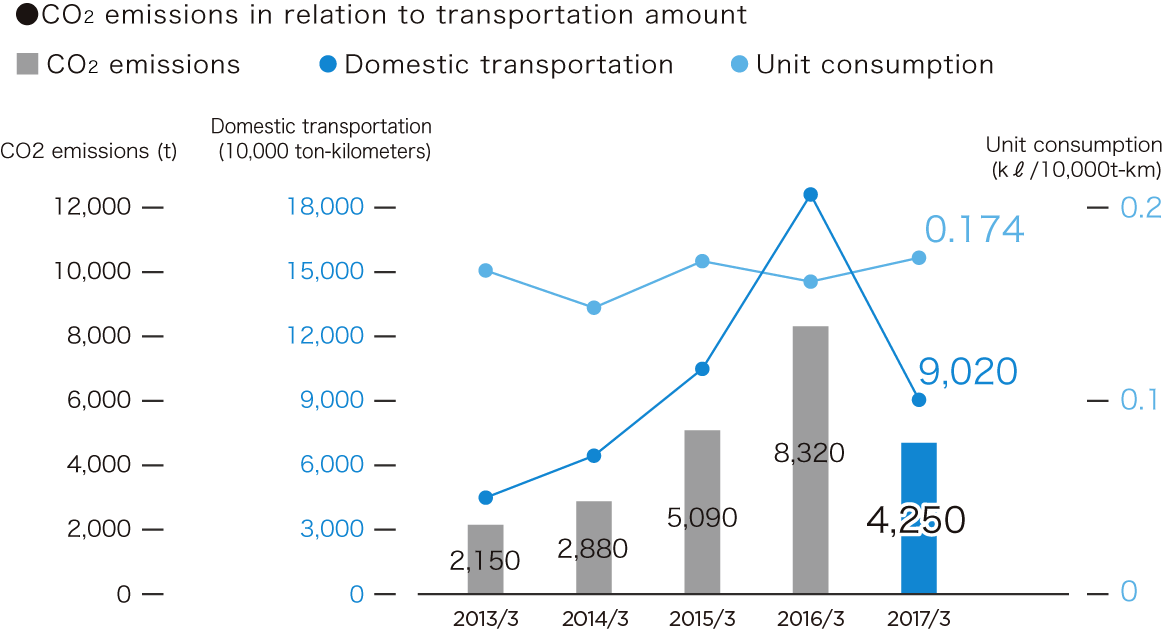
Promoting environmentally friendly transportation
※Subsidiaries data will not be provided after 2017 due to structure change.
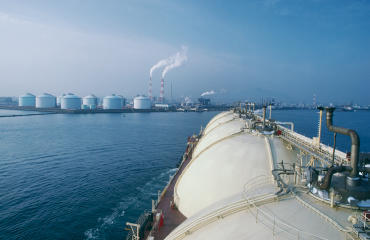
As a cargo owner, VES is actively tackling the issue of energy conservation in the field of transportation as well. One way in which we are doing this is by increasing the transportation loading rates. We also aggregate aspects such as shipping dates and destinations to reduce the number of dedicated ships and expand the use of consolidated shipments. All of these activities are aimed at reducing both CO2 emissions and energy consumption. The graph shows VES’s CO2 emissions over the past five years, as well as domestic transportation (ten thousand tons-kilo) and unit consumption (= amount of energy consumed for trans- portation per amount transported). Domestic transportation in 2017 decreased by approximately 50% from the previous year, while energy use per transportation increased by approximately 6% year on year.
Environmental management data of subsidiaries (Domestic factories of VES subsidiaries in Japan)
※Subsidiaries data will not be provided after 2017 due to structure change.
Energy conservation and CO2 emissions
The total volume of subsidiary energy consumption for 2017 was down approximately 10% from 2016. During that same period, the amount of electricity purchased by subsidiaries decreased by no more than approximately 4% from the previous year. CO2 emissions in 2017 were down approximately 13% due to a decrease in energy consumption and CO2 emission coefficient of electricity.
Effective use of aquatic resources
Water consumption has been increasing since 2013. In 2017, it was up approximately 2% from the previous year.
*1 TJ: Tera Joule (=1012J) *2 CO2 emissions were calculated by following the Guidelines for Calculating Corporate Greenhouse Gases Emissions issued by the Ministry of the Environment. CO2 emissions from electric power were calculated by using the adjusted CO2 emission coefficient for designated electric enterprises that was also published by the Ministry of the Environment.
Data related to waste
Compared to 2016, the amount of waste for 2017 increased by approximately 0.3%. Domestic subsidiaries include those involved in iron casting, steel casting manufacturing, and ship repair operations that differ from operations conducted by VES. As such, the breakdown of waste from our subsidiaries also differed from VES. Approximately 40% of the waste produced by domestic subsidiaries was slag (2017). Due to the progress in the recycling of slag, the recycle rate increased 0.2% from 2016, to approximately 70%.
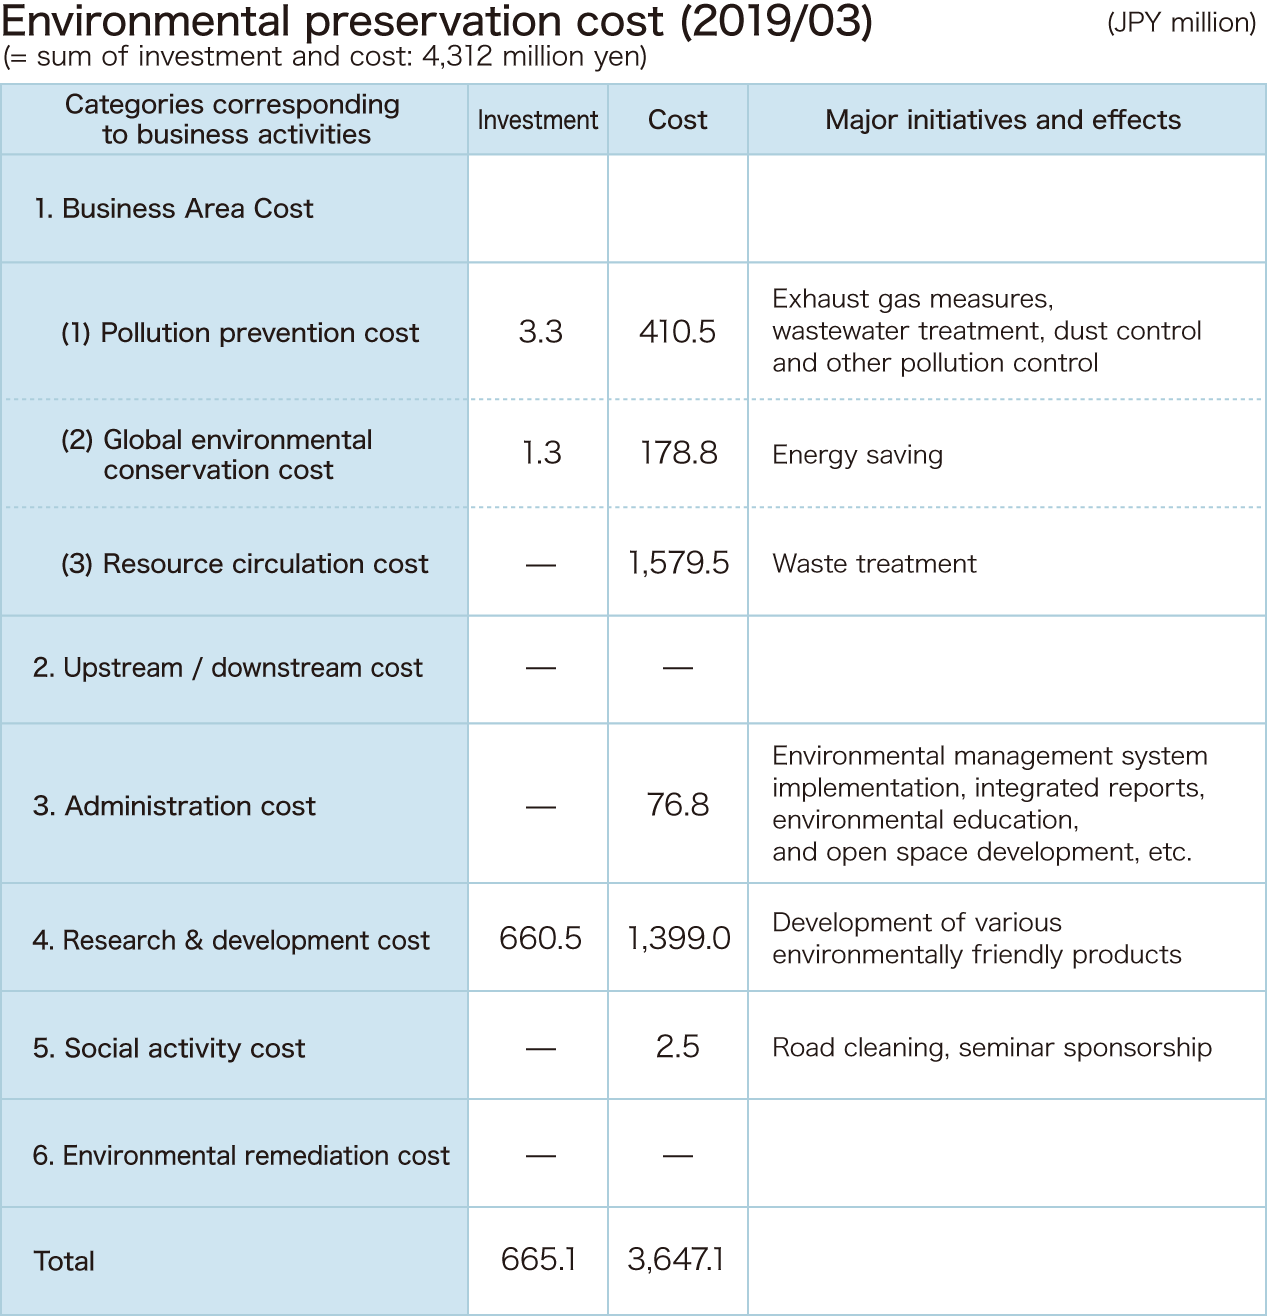
Environmental accounting (non-consolidated data for former VES)
VES spent a total of $4,310 million on investments and costs related to environmental preservation efforts. A detailed break-down of these expenditures is shown on the bottom. The categories for environmental preservation costs are based on the Environmental Conservation Cost Categories shown in the Environmental Accounting Guidelines 2005. These expenditures included a total of $670 million spent on investment, consisting of $660 million spent on research and development, $330 mil-lion spent on pollution prevention cost such as exhaust gas measures, and $130 million spent on energy conservation of global environment conservation. Total non-investment costs came to $3,650 million, which included $1,400 million spent on the research and development of environmentally friendly energy-saving products, $410 million as the cost for preservation of the global environment, including energy conservation, $130 million allocated to resource circulation costs such as waste treat-ment, and $1,580 million for pollution prevention costs.