- Home
- Financial Highlights
Financial Highlights
Financial Data (Consolidated)
(Millions of dollars)
| 2015/03 | 2016/03 | 2017/03 | 2018/03 | 2019/03 | |
|---|---|---|---|---|---|
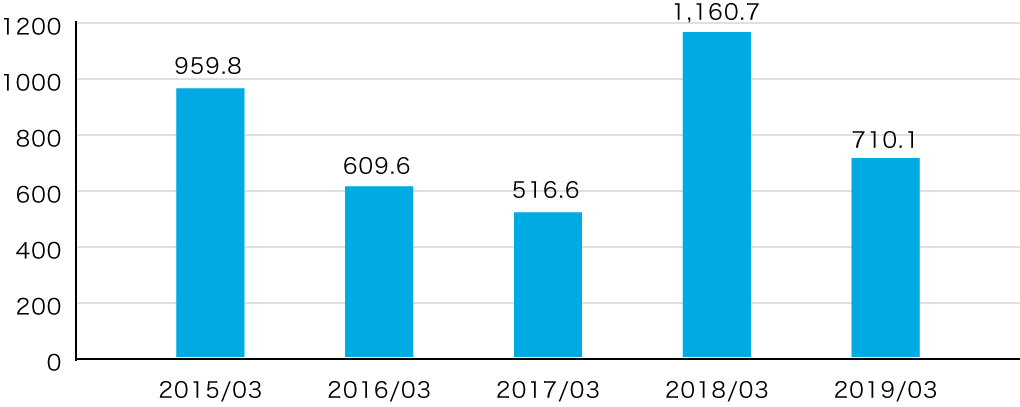
| New Orders | 959.8 | 609.6 | 516.6 | 1,160.7 | 710.1 |
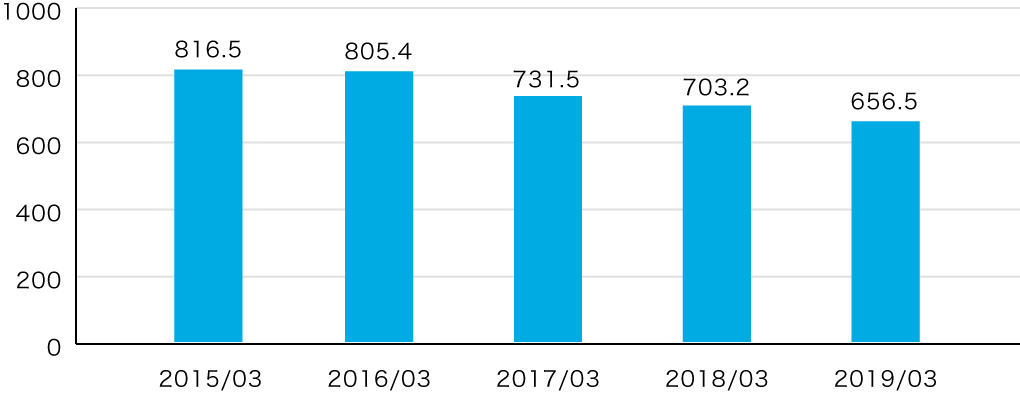
| Net Sales | 816.5 | 805.4 | 731.5 | 703.2 | 656.5 |
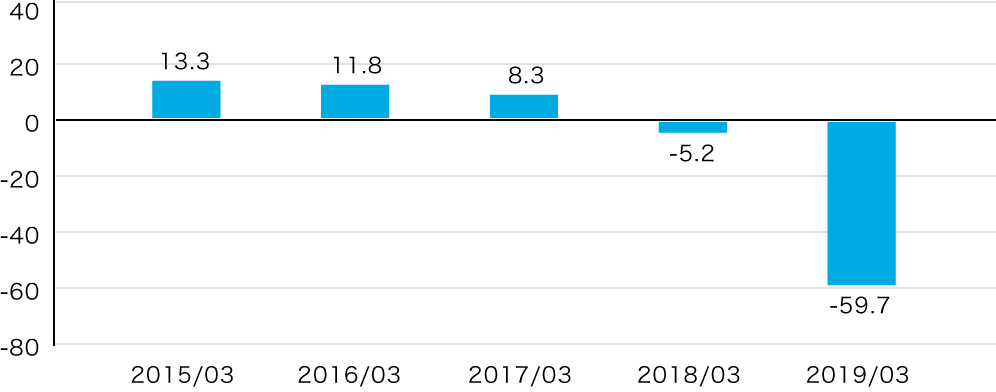
| Operating Income | 13.3 | 11.8 | 8.3 | -5.2 | -59.7 |
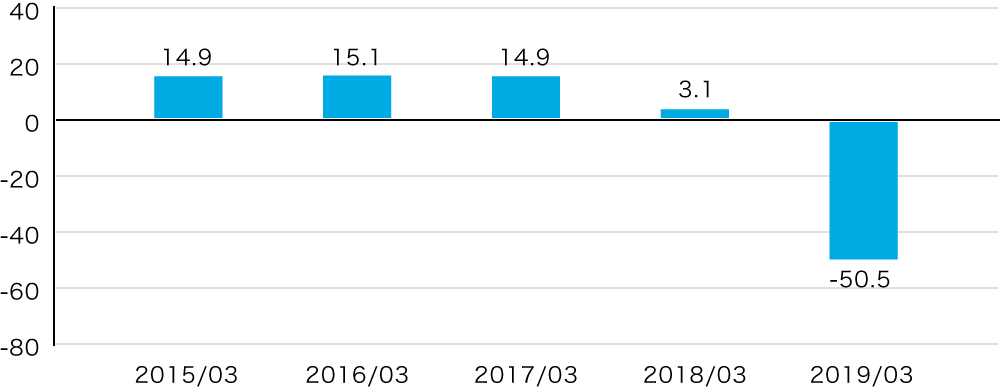
| Ordinary Income | 14.9 | 15.1 | 14.9 | 3.1 | -50.5 |
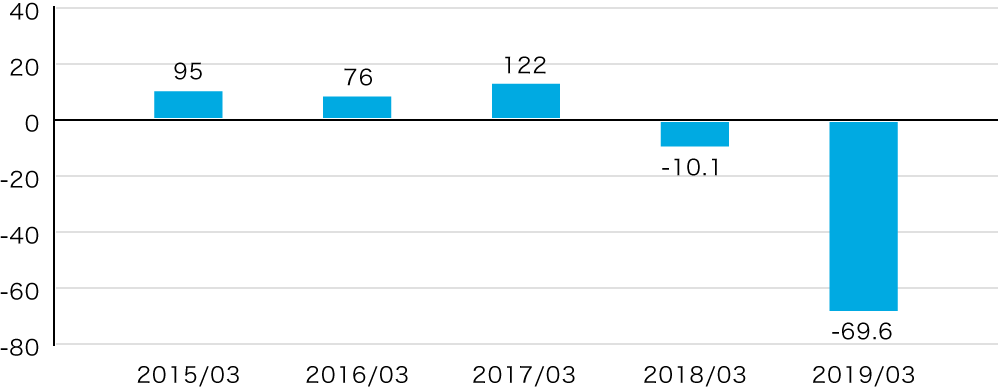
| Net Income | 9.5 | 7.6 | 12.2 | -10.1 | -69.6 |
| Total Assets | 1,074.6 | 1,094.0 | 1,096.7 | 1,029.2 | 999.1 |
| Net Assets | 347.3 | 343.9 | 367.6 | 356.8 | 280.2 |
| Shareholders' Equity | 236.7 | 234.8 | 250.4 | 239.2 | 159.5 |
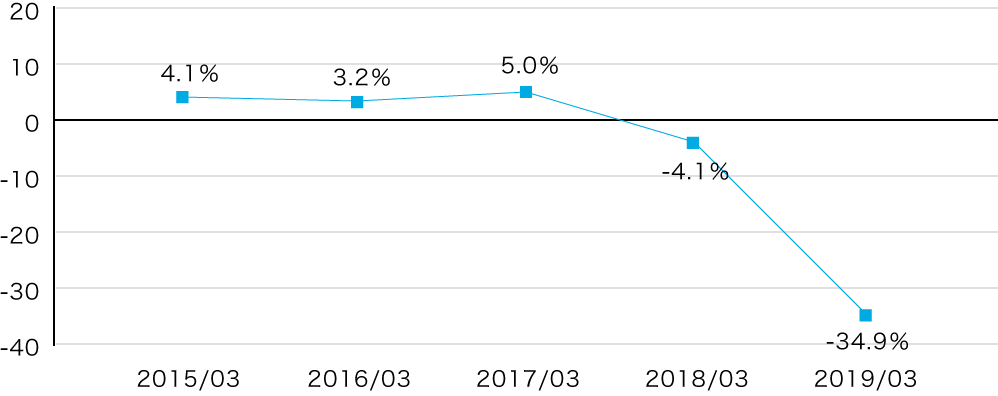
| ROE (Return on Equity) | 4.1% | 3.2% | 5.0% | -4.1% | -34.9% |
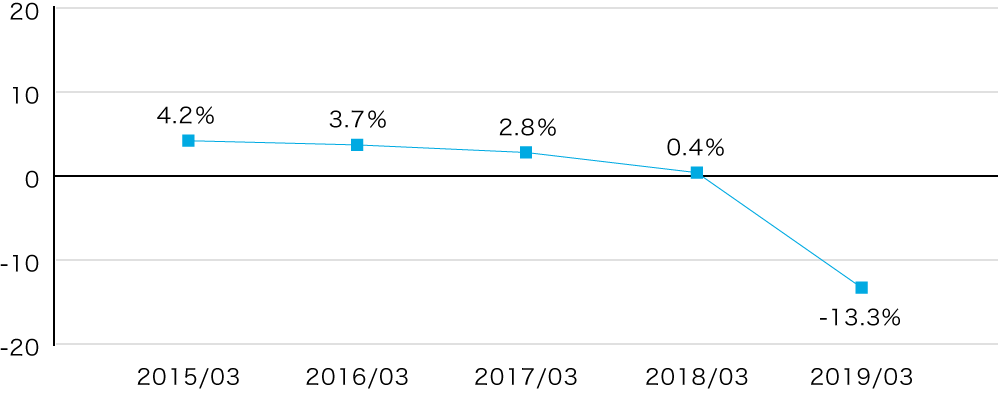
| ROIC (*) | 4.2% | 3.7% | 2.8% | 0.4% | -13.3% |
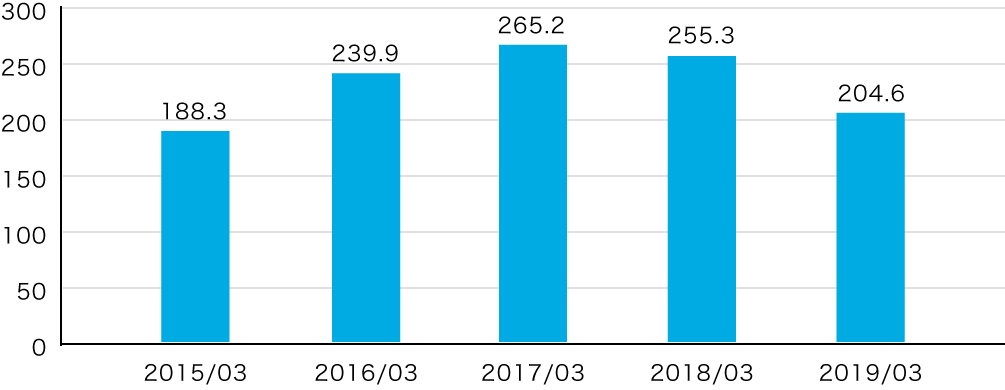
| Interest-bearing Debt | 188.3 | 239.9 | 265.2 | 255.3 | 204.6 |
* Return on Invested Capital (ROIC) = Operating Income + Interest and Dividend Income Average of Shareholders' equity + Average of Interest-bearing Debt
New Orders
(Millions of dollars)
Net Sales
(Millions of dollars)
Operating Income
(Millions of dollars)
Ordinary Income
(Millions of dollars)
Net Income
(Millions of dollars)
ROE (Return on Equity)
ROIC (Return on Invested Capital)
Interest-bearing Debt
(Millions of dollars)
New Orders & Sales by Segment (Consolidated)
New Orders by Segment
(Millions of dollars)
| 2015/03 | 2016/03 | |
|---|---|---|
| Ships | 536.1 | 297.8 |
| Machinery | 203.6 | 172.2 |
| Engineering | 182.4 | 100.9 |
| Others | 37.7 | 38.6 |
| Total | 959.8 | 609.6 |
| 2016/03 | 2017/03 | 2018/03 | 2019/03 | |
|---|---|---|---|---|
| Ship | 109.0 | 67.7 | 106.9 | 113.2 |
| Ocean Development | 188.8 | 92.7 | 700.9 | 254.2 |
| Machinery | 172.2 | 166.8 | 186.9 | 185.3 |
| Engineering | 100.9 | 149.9 | 75.4 | 58.9 |
| Others | 38.6 | 39.4 | 90.5 | 98.5 |
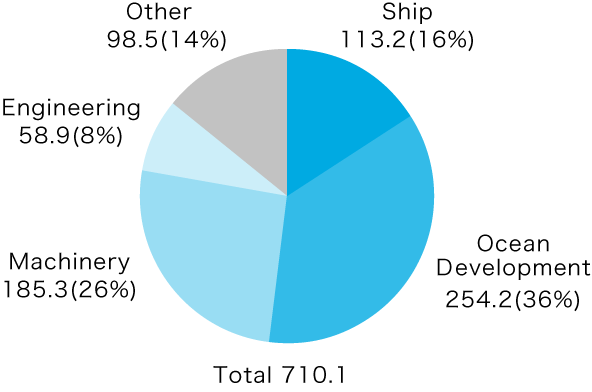
| Total | 609.6 | 516.6 | 1,160.7 | 710.1 |
New Orders by Segment (2019/03)
(Millions of dollars)
Sales by Segment
(Millions of dollars)
| 2015/03 | 2016/03 | |
|---|---|---|
| Ships | 481.0 | 423.8 |
| Machinery | 167.1 | 171.7 |
| Engineering | 129.6 | 171.3 |
| Others | 38.7 | 38.7 |
| Total | 816.5 | 805.4 |
| 2016/03 | 2017/03 | 2018/03 | 2019/03 | |
|---|---|---|---|---|
| Ship | 128.8 | 126.7 | 112.5 | 96.9 |
| Ocean Development | 295.0 | 228.4 | 191.2 | 222.5 |
| Machinery | 171.7 | 174.8 | 181.7 | 186.9 |
| Engineering | 171.3 | 162.6 | 127.6 | 69.0 |
| Others | 38.7 | 38.9 | 90.2 | 81.3 |
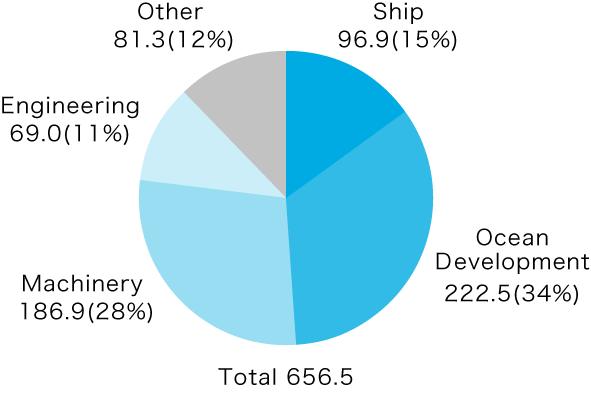
| Total | 805.4 | 731.5 | 703.2 | 656.5 |
Net Sales by Segment (2019/03)
(Millions of dollars)
Employees (Consolidated)
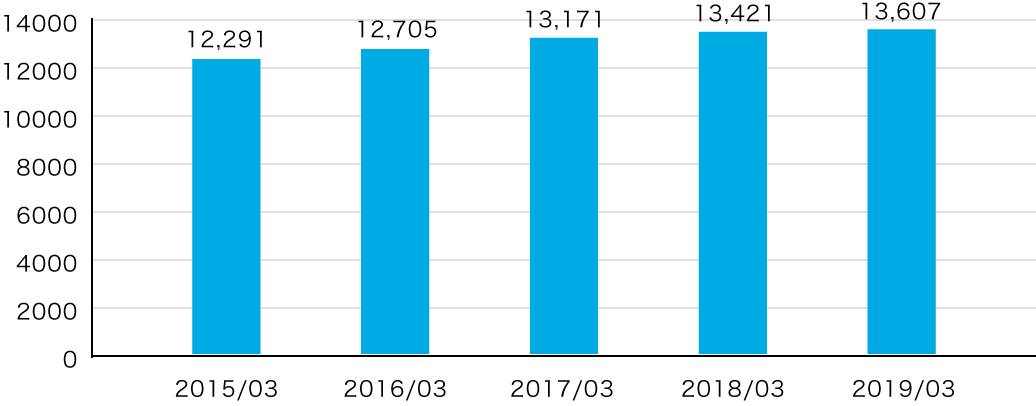
| 2015/03 | 2016/03 | 2017/03 | 2018/03 | 2019/03 |
|---|---|---|---|---|
| 12,291 | 12,705 | 13,171 | 13,421 | 13,607 |
Employees
(People)
Forecast of Financial Results for 2020/03(as of May 10, 2019)
(Millions of dollars)
| Net Sales | Operating Income | Ordinary Income | Net Income | |
|---|---|---|---|---|
| Consolidated year ending March 31, 2019 |
840 | 12 | 17 | 3 |
Reference: Estimated assuming USD 1=EUR 0.92615 as currency exchange rate


